River north Tyne and salmon DATA
1. pH, temperature, dissolved oxygen, ammonia, fish mortality
at the different gauging stations, (Jarrow, Newcastle Swing Bridge, Biwell, Riding Mill, Haydon Bridge, Ugly dub).Both for one day and night in Winter, Spring, Summer, Autumn 2010. Also monthly for as long as records held.
2. Flow rate.(cubic m/sec)
Both for one day and night in Winter, Spring, Summer, Autumn 2010. (If possible, for the flow rate measurements to be as frequent as possible, depending on how how often measured). Also monthly for as long as records held.

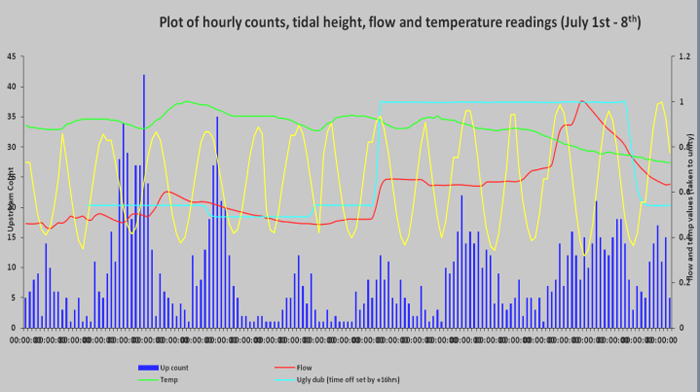
3. Fish Count Data.(Riding Mill)
Daily and weekly for 2010. Also monthly for as long as counting made,as well as annual totals.
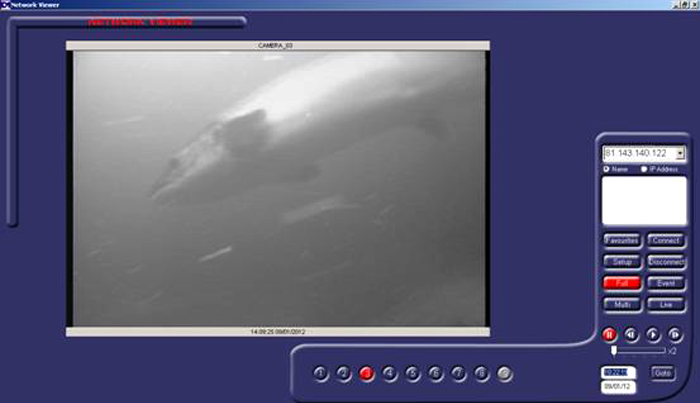
For now, we will use 2010 numbers as well as stills and video footage.

4. Smolt Counts.
Daily and monthly figures when making counts in smolt traps. Also any data regarding smolt numbers/behaviour to effects of water temperature and flow rates, for as long as have been taking measurements. Also interested in the timing of the smolt run, i.e. when that is, whether and what changes it etc…
5. Fish Scales.
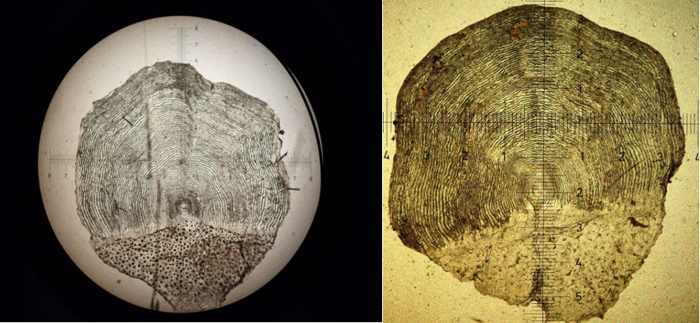
Salmon scales from Tyne caught fish in 2010. (ideally from different times of year) including the written diagnosis of fish knowledge acquired from EA.

6. Geomorphology and Topographical maps of the river Tyne .
showing rock, soil and sediment types and depths of earth’s crust through which Tyne valley cuts. Any cross section maps or diagrams that show this data as well as how river has changed its course over time would also be extremely useful.
All data provided by Environment Agency North East, in collaboration with Jon Shelley, Niall Cook and Morton.